• Skip to main content

Understanding and Using New Data Sources to Address Urban and Metropolitan Freight Challenges

National Cooperative Freight Research Program (NCFRP) Project 49

  • Urban and Metropolitan Challenges
    • Congestion
    • Last-Mile Access
    • Final 50-feet Access
    • Land Use
    • Truck Parking
    • Case Studies
  • Emerging Data Sources
    • GNSS/GPS
    • Radar
    • Wireless Address Matching
    • Administrative Records
    • Cellular/GSM
    • Induction Loops
    • LIDAR
    • Computer Vision
  • Analytical Approaches
    • Speed
    • Location
    • Re-identification
    • Classification
  • Stewardship Principles
    • Transparency and Openness
    • Purpose Specification
    • Data Minimization
    • Data Quality and Accuracy
    • Accountability
    • Security
    • Data Management
  • Resources
    • Source Use Concept Map
    • Case Studies
    • Previous NCFRP Projects
    • Glossary
    • Sources Cited
Home » Resources » Source Use Concept Map

Source Use Concept Map

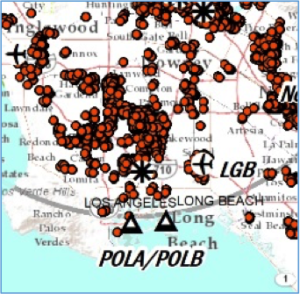
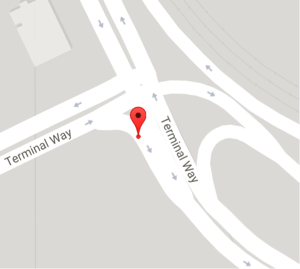
A key finding of this research is the concept of data fusion, or the combination of data from multiple sources to generate new actionable insights. For example, combining origins and destinations from truck GPS data with land use or business location data can yield insights into the types of freight being carried on specific routes.

Data fusion is valuable because the combination of data sources unlocks the value of both new and existing data sources by shining a light on previous blind spots. Fusing data sources is becoming increasingly feasible as data and analytical tools become more easily available and affordable. To leverage data fusion, agencies must understand and decide to what end and how data sources will be analyzed, i.e. which persistent urban and metropolitan freight challenges will the analyses address.

The Source-Use Concept Map below shows how different types of data, analytical methods, and challenges are linked. The five Persistent Challenges identified in this research are on the left. Emerging and new Data Sources are on the right. The middle shows how Analytical Approaches fuse a variety of data sources from the right into insights for decision-making.


Semi-trucks parked in a row in a parking lot.

Bitkiz / Shutterstock.com

Truck Parking

Problem Description:

Shortage of truck parking indirectly affects mobility; lack of driver knowledge of available parking affects driver choices and behavior near freight facilities.

How it Relates:

Location and classification can help understand which trucks typically need parking and how often they use those facilities, while precisely identifying their location.

More…

Source: Anna Bovbjerg, Urban Freight Lab

Final 50-Foot Access

Problem Description:

Loading and unloading trucks can block lanes. Often they circle looking for space to load/park; both issues exacerbate traffic.

How it Relates:

Classification of vehicles (small vs. large trucks) and records of business and loading zones can provide greater visibility of areas where Final 50-Foot Access Issues may exist.

More…

astudio / Shutterstock.com

Last Mile Access

Problem Description:

Last mile access issues include queuing caused by inefficient signalization, capacity constraints (including off-ramps), circuitous routing (ingress, egress constraints), incompatible corridor uses (e.g. bicycle lanes on freight corridor). All of these issues result in congestion and potential hazards to other road users.

How it relates:

Location, classification and re-identification of vehicles through the network can provide insights into which road corridors are particularly important for freight, and whether or not those corridors perform adequately.

More…

Source: Ssangyun Kang’s Workshop 1 Presentation.

Land Use

Problem Description:

Land uses not synchronized with freight demand, resulting in additional freight VMT, congestion, circuity.

How it relates:

Information about the location of freight origins and destinations, or through trips of specific trucks (through vehicle re-identification) can help planners understand which areas of a metropolitan area have the highest concentrations of freight activity. This knowledge can be used to inform land use planning with the goal of reducing freight frictions from incompatible land uses.

More…

Source: Tom Murtha’s Workshop 1 Presentation. Slide on truck bottlenecks.

Congestion

Problem Description:

Highway and street congestion delays freight shipments. Congestion could either be intersection/interchange congestion, mainline congestion or at natural or man-made barriers such as rivers or border crossings

How it Relates:

Vehicle speed is often used as a measure of congestion. This speed can be provided by GPS and RADAR sensor, and combined with location data from a variety of sources. Together, speed and location data can show how truck congestion varies across time and space in a network.

More…

Source: https://cvlab.epfl.ch

Classification

An object’s classification (ex: truck, car, pedestrian) can be determined by its size and shape. This information can be derived from the analysis of signals received by RADAR and LiDAR equipment, by the magnitude and pattern of magnetic pulses sensed by induction loops, or through analysis of camera images (shown).

More…

Source: Hernandez slides from Workshop 1

Re-Identification

The unique attributes of a vehicle mean that it can be observed at different places and times throughout the network, and routes and speeds may be inferred from different observations. Wireless Address and Cellular protocols transmit identifying codes that can be assigned to a specific vehicle, and then observed. Additionally, each vehicle produces a unique magnetic signature (shown) that can be identified by inductive loops in roadways, and tracked across a loop-equipped network.

More…

Source: Snip from Google Maps

Location

GPS and Cellular systems determine location by comparing the difference in signals from different transmitters like satellites or cell phone towers. Administrative records will have location assigned in the form of an origin or destination field, and the physical placement Wireless Address Matching equipment can be recorded as a location.

More…

Source: FHWA https://safety.fhwa.dot.gov

Speed

Speed is calculated in one of two ways. For GPS/GNSS data, speed can be determined by comparing the time and location of GPS observations. For RADAR, speed can be determined by measuring the change in frequency of signals being received by the RADAR unit.

More…

Source: Miovision website

Computer Vision

Computer vision systems process images captured by still or motion cameras to determine qualities like shape, size, and color of objects. This basic information can then be used to classify objects, determine their speed and path of movement.

More…

Source: https://techcrunch.com

LiDAR

LiDAR sensors emit pulses of invisible light and analyze the patterns of light that returns to the sensor. Through this analysis of light patterns, LiDAR can generate images of objects, and classify objects based on their images.

More…

Source: Hernandez powerpoint from Workshop 1

Inductive Loop Signature

Inductive loops measure the magnetic field above a section of roadway. Simple loops sense the presence of a vehicle by detecting a change in the magnetic field. More advanced sensors can record the specific change in the field over time, which can be used to generate a magnetic “signature” of vehicles passing over the sensor.

More…

Source: https://thenounproject.com

Cellular / GSM

Cellular or GSM (Global System for Mobile Communications) data is produced via mobile phones and the associated phone towers that transmit various types of signals to carry voice and data. The various signals can be used to locate a mobile phone in time and space.

More…

Source: https://cdn.jjkeller.com

Administrative Records

Administrative records include items like shipping records and freight manifests, sales and order data, and business registrations. These records can be used to identify locations that may have high concentrations of freight activity, and identify major freight system users.

More…

Wireless Address Matching

Source: Bluetooth.com press kit.
Wireless communications equipment with Bluetooth® capability all have a unique device identifier, known as a Media Access Control (MAC) address which is broadcast to other devices to signal the device’s presence. Observations of this address can be collected by roadside wireless detectors and these observations can be used to determine speed and route by interpolating among successive observations.

More…

Source: https://ops.fhwa.dot.gov/

RADAR

Radar sensors detect objects in the sensor’s surrounding by transmitting radio waves into the environment and capturing the patterns of returning waves. These patterns can be analyzed to detect objects and derive additional information, like object location, speed, and heading.

More…

Source: https://www.gps.gov/

GPS / GNSS

Global Navigation Satellite Systems (GNSS), including the Global Positioning System (GPS), receive time and location data from many satellites that orbit the earth. Road vehicle onboard navigation devices use the differences in information received from different satellites to calculate the device’s location. This location information can be archived for later analysis of vehicle speed and routing.

More…

Final 50-ft Access — Location Truck Parking — Classification Truck Parking — Re-Identification Final 50-ft Access — Classification Last Mile Access — Classification Last Mile Access — Re-Identification Last Mile Access — Location Land Use — Re-Identification Land Use — Location Congestion — Location Congestion — Speed Classification — Computer Vision Classification — LiDAR Classification — Inductive Loop Signature Re-Identification — Inductive Loop Signature Re-Identification — Cellular/GSM Classification — RADAR Re-Identification — Wireless Address Matching Location — Cellular/GSM Location — Administrative Records Location — Wireless Address Matching Location — GPS/SNSS Speed — RADAR Speed — GPS/SNSS [su_lightbox type="inline" src="#fancy-truck-parking-info" class="fancybox-inline"] [/su_lightbox] [su_lightbox type="inline" src="#fancy-last-50-ft-access" class="fancybox-inline"] [/su_lightbox] [su_lightbox type="inline" src="#fancy-last-mile-access" class="fancybox-inline"] [/su_lightbox] [su_lightbox type="inline" src="#fancy-land-use" class="fancybox-inline"] [/su_lightbox] [su_lightbox type="inline" src="#fancy-congestion" class="fancybox-inline"] [/su_lightbox] [su_lightbox type="inline" src="#fancy-classification" class="fancybox-inline"] [/su_lightbox] [su_lightbox type="inline" src="#fancy-re-identification" class="fancybox-inline"] [/su_lightbox] [su_lightbox type="inline" src="#fancy-location" class="fancybox-inline"] [/su_lightbox] [su_lightbox type="inline" src="#fancy-speed" class="fancybox-inline"] [/su_lightbox] [su_lightbox type="inline" src="#fancy-computer-vision" class="fancybox-inline"] [/su_lightbox] [su_lightbox type="inline" src="#fancy-lidar" class="fancybox-inline"] [/su_lightbox] [su_lightbox type="inline" src="#fancy-loop-signature" class="fancybox-inline"] [/su_lightbox] [su_lightbox type="inline" src="#fancy-cellular" class="fancybox-inline"] [/su_lightbox] [su_lightbox type="inline" src="#fancy-admin-records" class="fancybox-inline"] [/su_lightbox] [su_lightbox type="inline" src="#fancy-radar" class="fancybox-inline"] v [su_lightbox type="inline" src="#fancy-wireless-address-matching" class="fancybox-inline"] [/su_lightbox] [su_lightbox type="inline" src="#fancy-gps-gnss" class="fancybox-inline"] [/su_lightbox]

Copyright 2019, National Academy of Sciences. All rights reserved.