• Skip to main content
  • Skip to primary sidebar

Understanding and Using New Data Sources to Address Urban and Metropolitan Freight Challenges

National Cooperative Freight Research Program (NCFRP) Project 49

  • Urban and Metropolitan Challenges
    • Congestion
    • Last-Mile Access
    • Final 50-feet Access
    • Land Use
    • Truck Parking
    • Case Studies
  • Emerging Data Sources
    • GNSS/GPS
    • Radar
    • Wireless Address Matching
    • Administrative Records
    • Cellular/GSM
    • Induction Loops
    • LIDAR
    • Computer Vision
  • Analytical Approaches
    • Speed
    • Location
    • Re-identification
    • Classification
  • Stewardship Principles
    • Transparency and Openness
    • Purpose Specification
    • Data Minimization
    • Data Quality and Accuracy
    • Accountability
    • Security
    • Data Management
  • Resources
    • Source Use Concept Map
    • Case Studies
    • Previous NCFRP Projects
    • Glossary
    • Sources Cited
Home » Urban and Metropolitan Challenges » Final 50-feet Access

Final 50-feet Access

Final 50 feet and Urban Deliveries Problem

The concept of Final 50-feet refers to the behavior of trucks when they are parked at or moving near the point of pick-up or delivery, especially in dense urban areas.

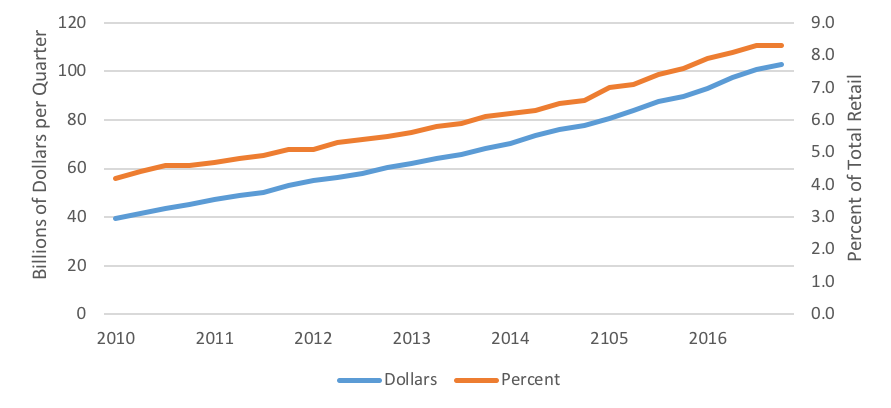
Local truck deliveries during daytime business hours both contribute to, and are affected by congestion on streets of a central business district. These local deliveries include activities such as parcel pickups and drop-offs at homes and businesses and product deliveries to stores. The traffic disruptions associated with these deliveries have negative impacts on productivity, quality of life and air quality. Increasing online commerce, shown in the figure, is one driver of urban freight traffic, as consumers’ shopping trips are being replaced by multiple deliveries throughout the week. Another driver of delivery traffic and congestion is the use of just-in-time inventories for stores and restaurants. For example, New York City’s 18,000 restaurants receive an average of three to four deliveries per day, creating an estimated 72,000 to 96,000 daily truck trips in the city, just for restaurant supply (Regional Plan Association, 2016).

Local deliveries contribute to congestion in two ways: 1) loading and unloading trucks occupy parking spots or block traffic lanes, and 2) drivers spend time circling city blocks in search of proper parking. These parking and driving behaviors are a result of and contributor to urban congestion and an estimated 947,000 hours of vehicle delay per day are attributed to delivery truck parking (Oak Ridge National Laboratory, 2004). The consequence of this congestion may lead to lost productivity, increased air pollution, and decreased the quality of life in urban areas. However, previous research on the use of delivery trucks for e-commerce in lieu of personal vehicles for shopping has consistently shown that use of delivery trucks create less Vehicle Miles Traveled and less carbon dioxide emissions than the use of personal vehicles (Goodchild & Toy, 2016).

E-Commerce Growth Trends

E-Commerce Growth Trends
Source: (US Census Bureau, 2016)

Traditional management practices for loading zones are oriented towards restricting access and have been unable to deal with increasing delivery traffic.”

These restrictive practices include designating specific areas as loading zones or designating specific hours of the day as delivery times. Restrictive approaches are insufficient to meet current loading zone needs because available spots are still lower than peak demand, and violation of loading zone restrictions (such as cars parked in zones) is not well-enough enforced, resulting in further reduced capacity.

Primary Sidebar

  • Congestion
  • Land Use
  • Last-Mile Access
  • Final 50-feet Access
  • Truck Parking
  • Case Studies

Potential Data and Analytical Remedies

Loading Zone Management presents a suite of options to addressing the disruptions caused by and around loading and unloading activities. Booking systems are used by some European cities, and require that freight carriers reserve a time slot at a specific zone (Taylor, Giang, & Kogio, 2016). Monitoring systems can determine spot availability and communicate with carriers, and routing systems can send drivers to their first or second choice of zones (Chloupek, 2012). These systems collect data on vehicle occupancy, as well as commercial vehicle identification information (through pre-registrations), and time/occupancy violations. Overall, these zone management systems can help drivers find guaranteed parking, but they do not expand capacity or alter demand. However, the parking demand and utilization information derived from parking bookings, and observed availability counts could be used to support freight planning. Routing data could also be used to determine common freight thoroughfares.

Another option for final 50-feet access is demand-based pricing for loading zones. When utilization of loading zones is high, parking prices will rise, and when utilization is low, parking prices will fall. The goal of these systems is to incentivize carriers to make deliveries at non-peak times, as they will pay less in parking fees. The cities of New York, Chicago, and Seattle are conducting trials of demand-based pricing. In order for demand pricing to reflect current conditions, occupancy of spots must be monitored, and this data about zone utilization throughout the day can be used to gain a better understanding of temporal trends in a city’s freight flows.

Copyright 2019, National Academy of Sciences. All rights reserved.