Radars are active sensors1 that detect surrounding objects using radio waves (Sun, Bebis and Miller 2006). The sensor transmits radio waves into the environment; some of the waves strike objects which reflect the waves back to the receiver. A computer processes and analyzes the patterns of returning radio waves to detect objects and derive additional information, like object location, speed, and heading (Honma and Uehara 2001).
Source: FHWA Freeway Management and Operations Handbook
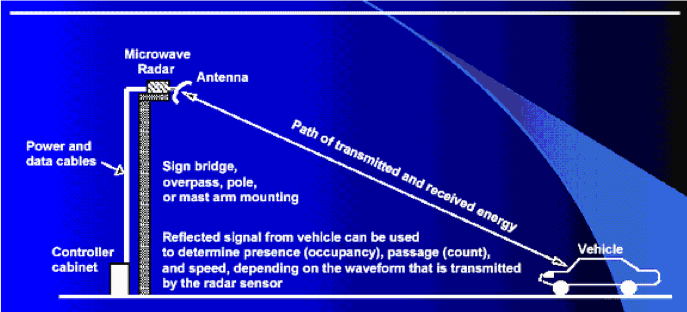
The figure below illustrates the operation of microwave radar sensors. A portion of the transmitted energy is scattered by the vehicle back toward the sensor, where it is detected and converted into vehicle and traffic flow information by the sensor alone or in conjunction with a roadside controller.
Radar may be a cost-effective replacement for in-roadway sensors because of Radar’s expanded sensing capacity. Presence-detecting radar sensors can monitor multi-lane freeway traffic flow and surface street vehicle presence and speed. In these applications, the Radar sensors replace a greater number of inductive loop detectors that are needed in the travel lanes. Furthermore, the sensor potentially provides direct measurement of speed at a greater accuracy than provided by the loops.
1 Active sensors—like radar, lidar, and ultrasonic—function by emitting a signal and measuring its return. Passive sensors—like cameras—acquire data by unobtrusively observing the environment.
What challenges do the data address?
Infrared-Doppler radar sensorRadar devices are used to measure speed, count, and classify vehicles on road segments, and to determine queue lengths (BITRE, 2014). Radars are frequently selected for many different data applications, due in part to their ability to function under conditions that would impede operation of other sensors. Most inclement weather—like rain, snow, or fog—does not decrease radar performance (Rasshofer and Gresser 2005). Performance is also unaffected if mud or dirt build-up on the sensor, and unlike cameras, radars do not require specific lighting conditions to function optimally. Radar is equally able to operate during daytime and at night. At high frequency, the technology can trace vehicle profiles; thereby enabling vehicle classified count data. Many radars are also compact, which can allow discrete placement and application to temporary count sites. Radar technology can help transportation planners determine how many trucks pass through specific points within a network. This knowledge can help improve understanding of a network’s freight flows.
Why is it new?
RADAR technology for transportation is not new. However, software capable of using radar signals to classify vehicles and objects more common to road transportation has been recently refined.
How are the data captured?
Two types of microwave radar sensors are used in roadside applications, those that transmit continuous microwave (CW) Doppler waveforms and those that transmit frequency modulated continuous waves (FMCW) (FHWA, n.d.). The constant frequency signal (with respect to time) allows vehicle speed to be measured using the Doppler principle: the frequency of the received signal is decreased by a vehicle moving away from the radar and increased by a vehicle moving toward the radar. Vehicle passage or count is denoted by a counting frequency shifts in the received signals. Vehicle presence cannot be measured with the constant frequency waveform as only moving vehicles are detected. By comparison, the FMCW microwave radar sensors detect vehicle presence and vehicle passage. Therefore, they can detect stopped vehicles and provide measurements of lane occupancy, vehicle count, speed, and vehicle length.
Radar sensors can be applied to diverse applications and ranges, and can function at short, mid, and long range—up to approximately 200 meters (Kissinger 2012). The range, function and other performance attributes are often linked to the frequency at which the radar operates (Sabertek N.D.). Radar and signal processing equipment installations, communications fiber or networks, and signal processing software are required, along with relational or other databases to store historical data over time. These capabilities may prompt agencies to choose radar over other possible solutions for classification.
What are policy considerations in its use?
Regulatory Environment: Facilitates data access and use.
Ownership: Not tightly controlled.
Privacy: Current applications typically protect private information.
There are no specific regulatory or privacy issues to be addressed with Radar technology. The captured data are not directly associated with any specific user. Generally, the sensors would be owned and deployed by the public agency, so data ownership should not be a concern.
What are institutional considerations in its use?
Capacity: Fairly easy to work with data.
Stewardship: Straightforward.
Equity: Data representative of specific roadway users.
The deployment and use of radar technology is not complicated. Most over-roadway sensors are compact and not roadway invasive, making installation and maintenance relatively easy. The cost of the sensors is low to moderate (hundreds to a few thousands of dollars) (FHWAb). Easy installation and relatively low cost means that these sensors can be deployed widely, mitigating sampling biases and equity concerns. Data stewardship is relatively straightforward, since most many radar sensor vendors also offer programs that store and structure the raw data collected by their sensors.
What are technical considerations in its use?
Completeness: Data gaps exist due to functionality issues.
Accuracy: Limitations due to functionality issues.
Verifiability: Access to raw data.
Dynamism: Time from capture to analysis is simplified by programs that store and structure raw data.
Durability: Low cost and ease of deployment and use ensure its future stability as a source of data.
Radars are capable sensors, but also have some notable limitations, listed below (Rasshofer and Gresser 2005). Radars can struggle with object detection and differentiation. The units also have a relatively poor angular resolution, and can struggle to identify the angular position of objects in its forward path. Limitations of the technology also include vehicle occlusion—i.e., vehicles being missed because they are partly or wholly occluded by a larger vehicle closer to the detector. Also CW Doppler sensors cannot detect stopped vehicles. Because the public agency has access to the raw data collected by each unit (when saved), data verifiability is not a concern. Since many sensor vendors also offer programs that quickly store and structure the raw data, and that perform data processing and analysis, data dynamicity is not a concern. Because the cost is low and the deployment and use is relatively straightforward, the durability of the technology is long-term.