Congestion is a mismatch between roadway capacity and demand. In other words, congestion occurs when there are many more drivers attempting to drive a stretch of road than the available capacity of that stretch. Under these conditions, drivers are forced to reduce speed to accommodate a larger number of vehicles.
Urban congestion includes congestion on both highways and local streets. In addition to the number of vehicles (volume), design features on urban area highways such as merging lanes, ramps, grades, interchanges, and reduced visibility around curves contribute to congestion. On local roads and at urban intersections, features such as constricted turns and lane-changing behavior also contribute to congestion as they cause drivers to quickly decrease speed. Driver behavior is further shaped by pedestrian and bicycle traffic on local roads and intersections. Weather, visual distractions, accidents, construction and maintenance, and special events may further affect the smooth flow of vehicles. In most cases, these factors do not operate in isolation; a number of them interact to exacerbate congestion at certain times of the day. Urban chokepoints such as bridges, tunnels (and in some cases border crossings) are a special circumstance where a number of the above-mentioned design and behavioral factors interact to create congestion. In many metropolitan areas, the greatest truck chokepoints are at major freeway interchanges.
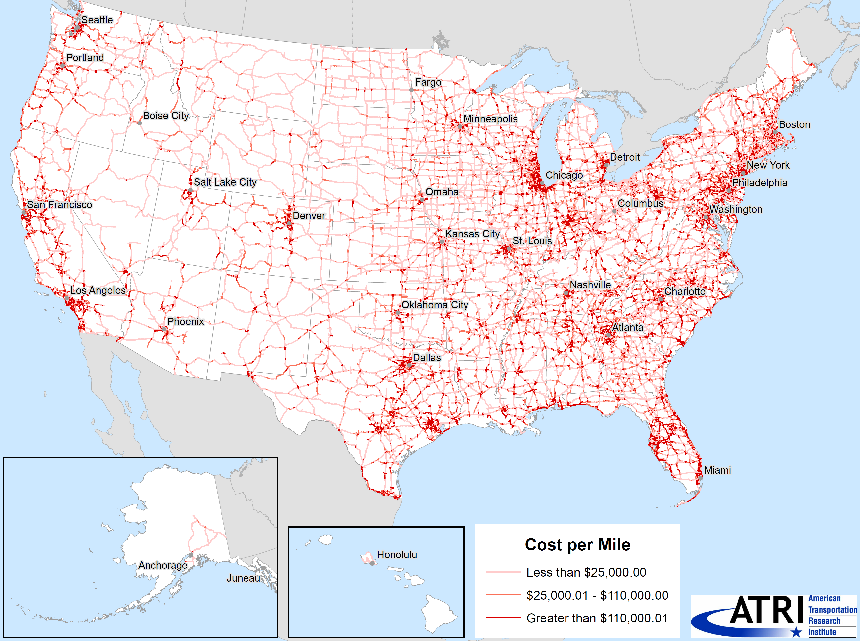
Congestion is most costly per mile of road in urban areas, where speed is chronically low and vehicle volumes are the highest. The figure below illustrates per-mile congestion costs (using 2015 data), and shows how costs are highest around urban areas, and lower in rural areas. In other words, annual congestion per mile in cities such as New York, Chicago, and Los Angeles costs at least four times more per mile than congestion in rural areas. This higher congestion cost in cities is a function of higher traffic volumes, and longer periods of congestion which means that when congestion occurs more vehicles are delayed, and more time and economic value are lost.
The immediate consequence of congestion on freight mobility is decreased productivity because congestion reduces the effective capacity of freight movement.”
Regional Differences in Freight Cost of Congestion per mile
In other words, the number of available hours and ability to move goods goes down when congestion goes up. Urban congestion in particular has a disproportionate impact on freight: trucks make up about 8% of urban traffic, but their delays account for $28 billion, or about 18% of the total cost of congestion in the US’s urban areas (Schrank, Eisele, Lomax, & Bak, 2015). For this reason, congestion has been one of the trucking industry’s top 10 concerns for over a decade (Brewster, Giragosian, & Newton, 2015). In 2016, congestion ranked as the 9th most critical issue, above the problem of driver distraction, and immediately below the issues of driver shortages and driver retention (American Transportation Research Institute, 2016).
Decreased freight productivity increases shipping costs, which may be passed on to businesses and consumers. In addition to its negative economic effects, congestion results in increased vehicle emissions, as vehicles move more slowly or idle, decreased air quality as a result of emissions, and decreased quality of life, as a result of both time lost, and air pollution (Barth & Boriboonsomsin, 2009).
The potential solutions to mitigating congestion are as varied as the causes of congestion. Rather than require capacity addition, many emerging data-driven solutions focus on equilibration, i.e. matching the demand for driving to effective capacity across space and time. All solutions to congestion will nonetheless have the following in common – they must examine the behavioral and structural factors contributing to congestion, and be designed to address the precise locations and regions that experience the most congestion. While such analyses have become routine for highways and major corridors, few studies look at congestion patterns in urban and downtown cores. Detailed truck observability is still a gap.