


This research has identified a number of urban and metropolitan freight mobility challenges, and how both existing and new data sources can be used in innovative ways to address those challenges.
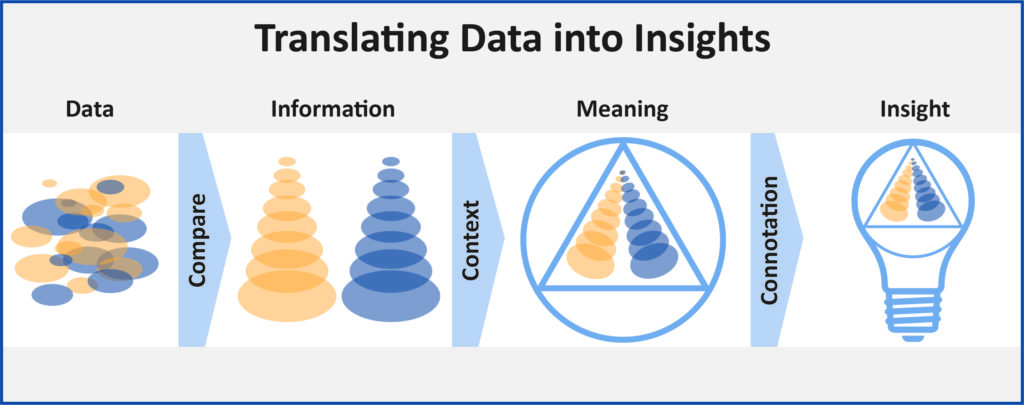
Data from these sources are rarely “plug and play”, as going from data to insight often requires a series of intermediate steps. As the graphic shows, data analysis produces information that is only meaningful in context. Meaningful findings taken in context guide decision-makers to conclusions or insights.
The analytical transformation or approach required to convert input data into useful information often requires an understanding of the behavior of people and goods in the transportation system. The understanding of behavior dictates how performance is to be measured. For example, congestion is a consequence of traffic overflow behavior on roadways with inherently limited capacity. Congestion is often measured by observing the speed of vehicles at different times of the day. The approach to measuring congestion requires a calculation of relative speed, and this is where the role of analytics comes in – to transform data (speed) into observed measures (relative speed) for a decision-making objective, ex. assessing congestion.
We identified four central analytical measures relevant to freight mobility applications: location, speed, re-identification, and classification. Each of these measures is discussed in more detail (links on the left), accompanied by a list of data sources that inform the analytical techniques to generate those measures.