• Skip to main content
  • Skip to primary sidebar

Understanding and Using New Data Sources to Address Urban and Metropolitan Freight Challenges

National Cooperative Freight Research Program (NCFRP) Project 49

  • Urban and Metropolitan Challenges
    • Congestion
    • Last-Mile Access
    • Final 50-feet Access
    • Land Use
    • Truck Parking
    • Case Studies
  • Emerging Data Sources
    • GNSS/GPS
    • Radar
    • Wireless Address Matching
    • Administrative Records
    • Cellular/GSM
    • Induction Loops
    • LIDAR
    • Computer Vision
  • Analytical Approaches
    • Speed
    • Location
    • Re-identification
    • Classification
  • Stewardship Principles
    • Transparency and Openness
    • Purpose Specification
    • Data Minimization
    • Data Quality and Accuracy
    • Accountability
    • Security
    • Data Management
  • Resources
    • Source Use Concept Map
    • Case Studies
    • Previous NCFRP Projects
    • Glossary
    • Sources Cited
Home » Emerging Data Sources Overview and Descriptions » Induction Loops

Induction Loops

Value Proposition – Inductive Loop Signature
What is the data source?
Inductive Loop Detectors (ILD) are usually wires buried in a roadway that emit an electromagnetic field in the vicinity of the loop. Loops can detect a passing vehicle due to changes in the emitted field and can provide information on time of detection and speed. Typically, these loop detectors have been used to derive vehicle presence, count or volumes, and travel times. Recently, loop detectors are being used to produce a unique signature that can allow for detailed vehicle classification.
What challenges do the data address?
Inductive loops with vehicle inductive signature capability allow transportation agencies to know more about what types of vehicles are traveling on the roadways, how fast and when. The vehicle inductive signature helps to identify whether the vehicle is a car or type of truck, a truck configuration that can be linked to commodity type, drive and duty cycle, and potentially air quality monitoring (FHWA, 2002). Signature data can also be used to validate other sources of data such as probe data and to provide volume information with accurate speed data that aids in prioritization of freight roadways based on volumes and congestion.

The benefits of using the new inductive loop signature include section-based performance measures (e.g. section travel time, travel delay, queue length), point-based performance measures (e.g. improved vehicle counts, vehicle classification, traffic speed at a particular location, etc.), and OD-based performance measures (e.g. turning movement counts, OD demand, trip travel time, delay, etc.). Because the system can potentially track vehicles all over the network through existing ILD locations, the tracking of heavy vehicles is not limited to WIM stations (Shin-Ting & Lianyu, 2015) (FHWA).

Why is it new?
ILDs have been in use since the 1960s, but past use of inductive loops only revealed the presence of a vehicle, time and speed. The new elements of ILD are the added dimension of classification, which is a critical need for transportation planners because it helps determine the mix of traffic. The new signature data can provide greater detail on what type of truck is moving. The knowledge of truck class can then be linked probabilistically to its commodity content, by fusing classification with other information from the U.S. Census Bureau’s Vehicle Inventory and Use (VIUS) survey or other information about contents. Knowing the commodity can help analysts to understand the types of commodities moving, the delay of these trucks and to compute cost of congestion based on the commodity type, as well as to design and prioritize improvements base on supporting particular commodity needs.
How are the data captured?
Loop detectors are typically a hexagon-shaped set of wires buried in the road surface. When a vehicle passes over the detector, its metallic mass causes fluctuations in the detector’s inductance. The fluctuations create a pulse that is read and recorded digitally (FHWA, 2002).

The principal components of an inductive loop detector are one or more turns of insulated wire buried in a shallow cutout in the roadway, a lead-in cable that runs from a roadside pull box to the controller, and an electronics unit located in the controller cabinet. The insulator wire loop can be excited with a signal ranging in frequency from 10 KHz to 200 KHZ and functions as an inductive element in conjunction with the electronics unit (FHWA, 2002).

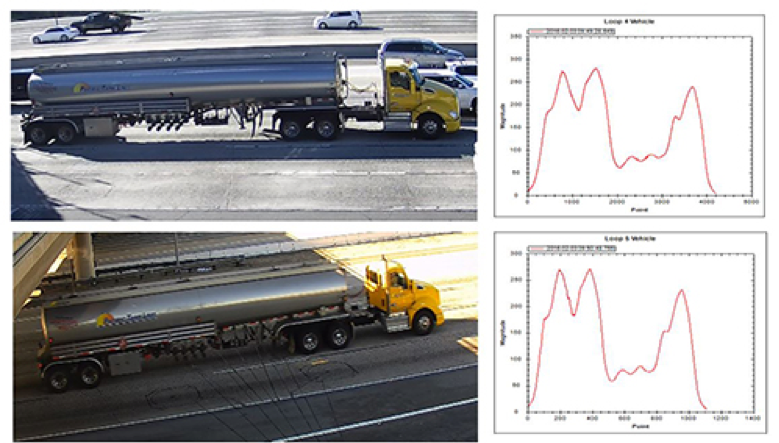
The newer inductive loop signature data uses an advanced detector card to generate inductive loop signature data from the existing ILD infrastructure. The advanced detector cards can replace the conventional ILD cards without interfering with the routing detector data collection in the field. Compared to the conventional detection systems that provide bivalent outputs (i.e. a binary (1 or 0) to detect truck presence (yes or no)) to indicate vehicle presence, the advanced detector card measures and outputs the inductance change in an ILD. This series of inductance changes caused by each traversing vehicle produces an analog waveform output and is referred to as the inductive loop signature or inductive vehicle signature (Shin-Ting & Lianyu, 2015). This signature can then be matched to specific classifications of vehicles and also probable contents to know the commodity being carried.

Inductive Loop Detectors Under Trucks and the Truck Inductive Loop Signatures, Volpe, 2017
What are policy considerations in its use?
  • Regulatory Environment: Facilitates data access and use.
  • Ownership: Not tightly controlled.
  • Privacy: Data not associated with any specific user.

There are no specific regulatory or privacy issues to be addressed with inductive loop detector technology. The captured data are not directly associated with any specific user. The equipment would be owned and deployed by a public agency so that data ownership should not be a concern.

ILD continues to be a technology with very consistent, accurate capability to capture traffic. Initially, there were challenges in sampling due to crosstalk, double or triple counting large trucks, but newer technology has greatly improved. Therefore, the information captured is increasingly reliable for use in decision-making and analysis.

What are institutional considerations in its use?
  • Capacity: Fairly easy to work with data but creating algorithms to categorize and analyze data requires special skills.
  • Stewardship: Straightforward.
  • Equity: Data representative of specific roadway users

Inductive loop detectors are usually installed and maintained by a state or local government. A program to ensure proper maintenance and management of the physical and digital elements of the system is necessary. One major consideration is coordination with a roadway maintenance division to protect the asset. When a roadway is milled, for example, the loop detector equipment gets destroyed. Coordination can help maintenance and construction divisions to ensure protection and proper replacement of the equipment. Additionally, funding is needed to continuously support the program. The loop detectors need to be maintained and the data pulled and analyzed. Hardware and software can be costly and needs to be upgraded over time.

Another aspect of this technology is the software and hardware needed to support the data collection or backend support and staff skills for analysis. The user will need to consider how the data is stored and supported over time, which can be costly. Some states and local governments are looking at pooled server support from a state-wide office of information technology or other public agencies resource. Additionally, staff with skills and experience in software to analyze the data, conflate it, use it in linear referencing and visualize it for decision-making are all necessary considerations.

What are technical considerations in its use?
  • Completeness: Newer signature inductive sectors may alleviate completeness issues.
  • Accuracy: Newer signature inductive sectors may alleviate completeness issues.
  • Verifiability: Raw data may not be available.
  • Dynamism: Time from capture to analysis can be quite short due to analytics.
  • Durability: Low cost and versatility ensure its future stability as a source of data.

There are several technical considerations. The following list the most known considerations by agencies currently using this technology (Shin-Ting & Lianyu, 2015):

  • Time and difficulty of installation – roadways need to be shut down for certain lengths of time for installation.
  • Fitting the loop to the cuts without crimping or nicks – the wires must be handled carefully.
  • Changes to inductance caused by the environment
  • Vehicle’s offset in a lane, which adversely affects repeatability
  • Vehicles with large differences in inductance
  • Vehicles changing lanes

However, newer signature inductive sectors may alleviate some of these challenges through:

  • Single roadway cut installation, which can cover multiple lanes and covers lane edge to lane edge
  • Faster, safer and easier installation (approximately ½ hour versus 4 hours)
  • Shorter traffic stoppage/impedance times, with minimal travel time loss
  • More defined signature data of advanced analytics of traffic
  • Uniform data over entire lane of traffic, regardless of vehicle lateral offset within the lane
  • No misses of turning or off-center vehicles like other loop technologies

Other technical considerations include the IT / telecomm hardware and software needed to continuously collect data. Fortunately, ILD provides a low maintenance and low cost solution in the ballpark of $700 per device that makes it an affordable option for traffic analysis. Additionally, they can be added to existing weigh-in-motion devices inexpensively to capture more detailed vehicle information that leads to estimates of truck activities and commodities.

Primary Sidebar

  • GNSS/GPS
  • Radar
  • Wireless Address Matching
  • Administrative Records
  • Cellular/GSM
  • Induction Loops
  • LIDAR
  • Computer Vision
Assessment of Challenges in Data Use

These ratings are depicted using green, yellow, and red, where green indicates ease of use of the data source, yellow indicates some hindrance in use, and red indicates difficult to use.

Policy Considerations
Regulatory Environment
Ownership
Privacy
Institutional Considerations
Capacity
Stewardship
Equity
Technical Considerations
Completeness
Accuracy
Verifiability
Dynamism
Durability
Definitions – Policy, Institutional and Technical Challenges

Copyright 2019, National Academy of Sciences. All rights reserved.